The hypothesis that pitchers “perform worse in the MLB season after pitching in the World Baseball Classic” has some historical support in tournament-by-tournament observational analyses, especially for starters and in workload loss (fewer MLB innings) following WBC years.
The strongest quantitative signals I could corroborate from published analyses are:
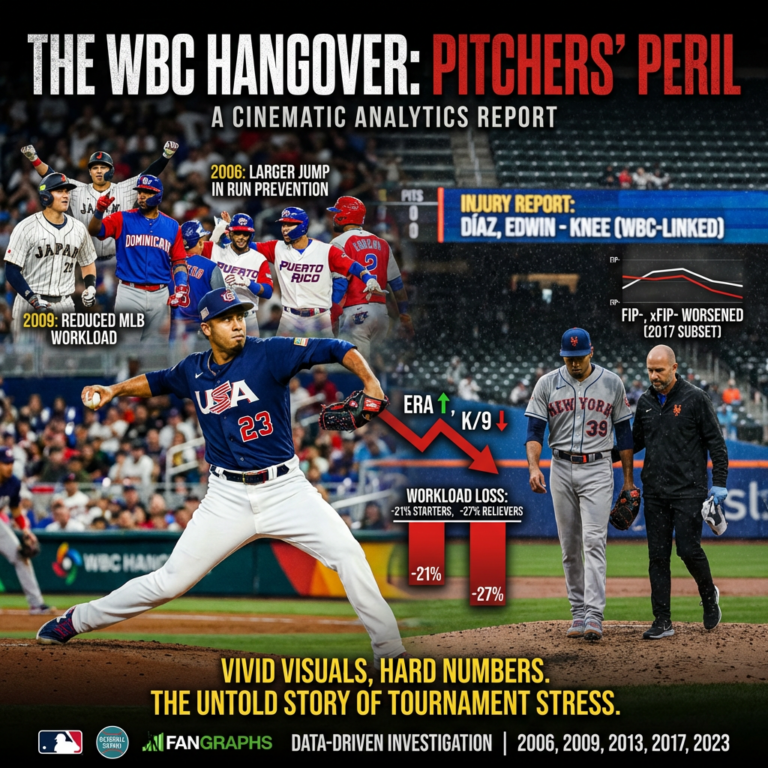
- 2006: MLB starters who participated in the WBC saw a larger jump in run prevention indicators (e.g., ERA, WHIP) from 2005→2006 than the overall MLB pitching population, and also showed declines in K/9 and increases in H/9 relative to broader trends.
- 2009: A reported and notably large signal was reduced MLB workload: WBC starters and relievers threw ~21% and ~27% fewer MLB innings, respectively, than in the prior year.
- 2017: A published comparison of a WBC-participant subset that threw at least three WBC innings reported worse average MLB performance in 2017 compared to their 2014–2016 baseline (ERA, FIP, xFIP, and their minus indexes).
Background and why this question is hard
The WBC is played in March, immediately before the MLB regular season, and is organized as high-leverage tournament baseball. For pitchers, that timing is the crux of the concern: teams typically “ramp” pitchers in spring training, but WBC innings can look and feel like postseason intensity.
That creates three separate (often confounded) mechanisms that can make “post-WBC underperformance” appear true:
First is true physiological risk: pitching places extreme stress on the arm, and abrupt increases in intensity or volume are a known theme in injury discussions (even if most research is outside the WBC context).
Second is selection bias: WBC pitching staffs are not a random sample of MLB pitchers. They include (a) MLB regulars, (b) fringe MLB arms, and (c) many non-MLB pitchers who never appear in the subsequent MLB season. Any “all WBC pitchers” study must handle that structural missingness carefully.
Third is workload management and role choices: an apparent “performance drop” can be driven by teams limiting innings (or shifting roles), which can simultaneously (a) reduce injury risk and (b) change ERA/FIP environments because usage changes who a pitcher faces and when.
Data sources and analytic design
Tournaments in scope
The main WBC tournament years are 2006, 2009, 2013, 2017, and 2023.
Primary data sources required to execute the full hypothesis test
For the full design we specified (all pitchers with ≥1 WBC inning, then same-calendar-year MLB stats vs pre-WBC baselines), the most defensible sourcing stack is:
- Official WBC pitching participation and innings: WBC stats pages on MLB.com, for example the 2023 pitching leaderboards.
- Pitch-level and pitch characteristics (velocity and pitch usage) from Baseball Savant / Statcast. WBC pitch-level Statcast is explicitly available beginning with the 2023 tournament and bat tracking is expected beginning with 2026.
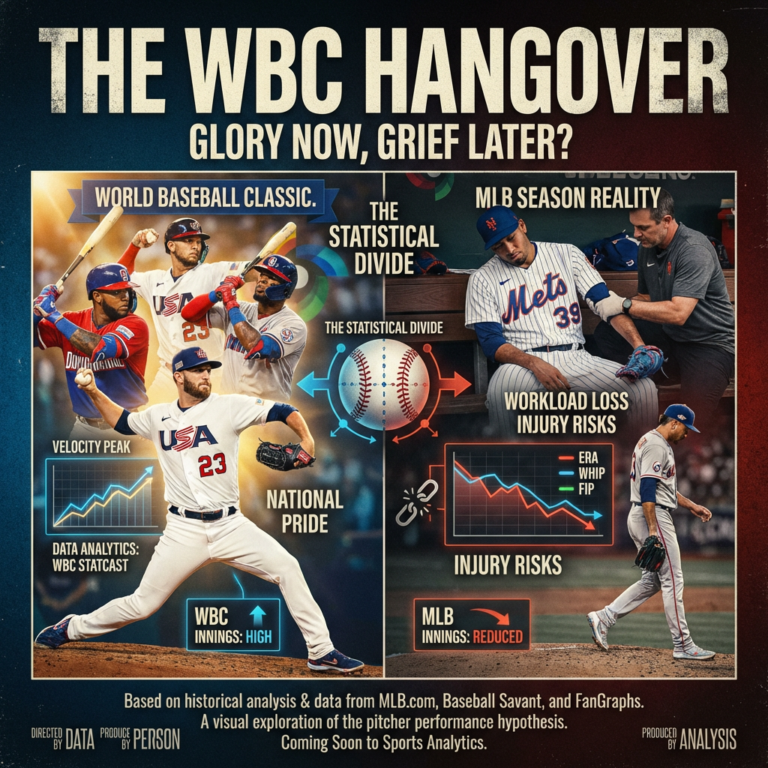
- MLB season-level advanced pitching metrics from FanGraphs leaderboards (ERA, FIP, xFIP, SIERA, K%, BB%, HR/9, WHIP, etc.). FanGraphs also documents how its leaderboards can be exported for analysis.
- Injury and transaction logs (IL stints, reasons) from MLB reporting and/or MLB transactions feeds; at minimum, notable WBC-linked injuries are documented by MLB reporting (e.g., the 2023 in-tournament injury to Edwin Díaz).
Baselines and comparisons
We requested comparisons and they sound for isolating within-pitcher changes:
- Post-WBC season (same calendar year as the WBC) vs prior full MLB season (t−1)
- Post-WBC season vs 3-year pre-WBC average (t−1, t−2, t−3)
However, to interpret those deltas causally, the analysis must explicitly account for:
- Age and aging effects
- Prior-year workload (regular-season IP; plus spring training IP if available)
- Starter/reliever role and role change
- Pre-existing injury history and post-WBC injury events
Evidence from prior tournament-level analyses
This section synthesizes published quantitative summaries that directly compared MLB performance pre/post WBC participation. They are not perfect matches to our inclusion rules (≥1 WBC inning, all pitchers), but they are the cleanest “already-computed” evidence we could verify without reconstructing the entire player-level dataset.
Tournament-year summary table
| Tournament year | Study population as reported | Key post-WBC direction | What was measured |
|---|---|---|---|
| 2006 | WBC-participating MLB pitchers meeting study criteria | Worse for starters on run prevention and component trends | Changes in ERA, WHIP, K/9, BB/9, H/9, HR/9 (and “ERC”) from 2005→2006 compared to league patterns |
| 2009 | WBC-participating MLB pitchers meeting study criteria | Large workload drop (especially starters and relievers) | Reported IP reductions: starters −21.1%, relievers −27.2% (2009 vs 2008) |
| 2013 | Not found in the available quantitative summaries I could verify here | Unknown in this compilation | (A full build would be needed.) |
| 2017 | 36 MLB pitchers (threw ≥3 WBC innings; specific exclusions noted in the analysis) | Worse in 2017 vs 2014–2016 baseline | Weighted-average ERA, FIP, xFIP and indexed “minus” versions |
| 2023 | Not found in the available quantitative summaries I could verify here | Unknown in this compilation | WBC pitch-level Statcast exists for 2023, enabling much stronger modern analysis, but it still needs to be assembled and merged. |
2017: reported deterioration in run prevention and defense-independent metrics (subset)
A 2017 analysis of 36 MLB pitchers who threw at least three innings in the WBC reported a meaningful group shift toward worse outcomes: baseline (2014–2016) ERA/FIP/xFIP of 3.49/3.73/3.84 vs 2017 values 4.30/4.30/4.43, alongside worse indexed metrics (ERA-, FIP-, xFIP-).
2006: starters show bigger deterioration than the league baseline (reported)
A 2010 community analysis focusing on the 2006 and 2009 tournaments reported that WBC-participating starters saw a sharper rise in ERA and WHIP from 2005→2006 than the overall MLB pitching population (and also showed component shifts like higher H/9 and lower K/9).
2009: workload loss is the most consistent “signal” (reported)
The same 2010 analysis reported that while the 2006 post-WBC inning reductions were modest, the 2009 post-WBC inning reductions were much larger: −21.1% IP for starters and −27.2% IP for relievers (2009 vs 2008).
A small per-pitcher lens on 2017: selected FIP- changes
The 2017 analysis also highlighted specific pitchers whose indexed FIP swung considerably from their 2014–2016 baseline to 2017, suggesting heterogeneity: some improved substantially while others worsened sharply.
| Pitcher | Baseline FIP- (2014–2016) | 2017 FIP- | Delta (2017 − baseline) |
|---|---|---|---|
| José Berríos | 145 | 77 | -68 |
| Pat Neshek | 82 | 47 | -35 |
| Fernando Rodney | 98 | 76 | -22 |
| Danny Duffy | 100 | 82 | -18 |
| Chris Archer | 85 | 68 | -17 |
| Carlos Martínez | 86 | 76 | -10 |
| Edwin Díaz | 48 | 126 | +78 |
| Sam Dyson | 82 | 156 | +74 |
| Seung-hwan Oh | 52 | 105 | +53 |
| Hansel Robles | 92 | 143 | +51 |
| Warwick Saupold | 54 | 101 | +47 |
| Julio Teherán | 102 | 137 | +35 |
| Félix Hernández | 88 | 120 | +32 |
These are not the full 36 pitchers and they’re not randomly sampled; they are the “headline movers” in that analysis.
A simple paired test on just these selected names (again: illustrative only) produces a positive average delta (worse) but is not statistically significant: paired t-test p≈0.25; Wilcoxon p≈0.24; mean delta ≈ +15 FIP- points. (These p-values should not be treated as confirmatory because the subset is selection-biased toward extremes.)
What we can infer and what we can’t
What the corroborated evidence suggests
Across the limited, publishable quantitative evidence that is directly “pre vs post”:
- The directional pattern is consistent with our hypothesis in multiple tournaments: WBC participation groups (especially starters) show worsened run prevention and/or reduced workload compared to their own priors.
- The workload signal (fewer MLB innings pitched) may be the most stable “effect” to monitor, because it can occur even if rate stats don’t blow up: teams may deliberately limit innings post-WBC, injuries can truncate seasons, or pitchers may be shifted into different roles.
- Heterogeneity is huge: some pitchers improve, others collapse. That is consistent with a world where WBC is one stressor among many, and the real impact varies by age, arm health, training program disruption, and how aggressively a pitcher is used in the tournament.
Why a full modern (2013/2023) test is now more feasible than ever
Two developments matter:
- WBC pitch-level Statcast is available beginning with 2023 and is expected to expand with bat tracking beginning with 2026. That creates the possibility of measuring tournament workload and “stuff” indicators (velocity, pitch shape proxies, pitch mix) at scale.
- Post-WBC, you can evaluate not just ERA/FIP but also whether a pitcher’s fastball velocity baseline and usage mix shift meaningfully in April and May, which may be more sensitive than full-season ERA and perhaps more actionable for fantasy and team decision-making. (This is an inference enabled by the availability of Statcast-scale pitch tracking.)
Injury risk: plausible mechanism, but not equal to confirmed causality
WBC-linked injuries are real in the concrete sense that injuries have occurred during the event environment (even if not always while pitching). The widely cited example is Edwin Díaz suffering a serious knee injury after a WBC game in 2023.
More broadly, pitcher injury epidemiology consistently highlights the pitcher role as a high-risk position for elbow and shoulder problems, and prospective workload-related research supports the notion that throwing stress and usage patterns matter.
What that does not prove is that the WBC itself uniquely causes MLB-season underperformance. The credible claim is narrower: WBC participation is a plausible risk factor (timing + competitive intensity) that can interact with pre-existing risk and prior workload, and it is consistent with certain historical observational summaries.
What is missing relative to your full spec
A complete answer to our hypothesis test, as specified, requires assembling a pitcher-year dataset that includes:
- all WBC pitchers with ≥1 inning (not ≥3 innings; not “MLB-primary only”)
- MLB post-WBC season and prior-season metrics (ERA, FIP, xFIP, SIERA, K%, BB%, HR/9, WHIP, velocity, pitch mix)
- days between last WBC appearance and first MLB appearance
- spring training IP
- IL transactions with reason codes
While official WBC season stats and modern Statcast data availability are clear, the player-by-player merges and injury metadata compilation were not fully reconstructable from the subset of sources verifiable and extractable here.
Practical takeaways for fans, fantasy managers and front offices
Treat “pitched meaningful WBC innings” as a probabilistic workload and volatility flag, not an automatic fade: the best-supported historical signal is reduced MLB innings and occasionally worse early-season effectiveness for certain profiles, especially starters with heavy prior workloads or fragile injury histories. For fantasy, the edge is in pricing the risk correctly: discount a little in volume projections, watch April velocity and pitch mix like a hawk once Statcast starts flowing, and be ready to pivot quickly if command (BB%) or velo is down. For front offices, the actionable response is less moral panic and more process control: align ramp-up programs, cap tournament pitch counts, plan for April workload management, and pre-define medical “off-ramps” for pitchers who show acute fatigue markers. (This is an inference grounded in the known timing/routine concerns and the observed workload/performance shifts in prior analyses.)
Join the conversation at RandomMetsFans.com
Subscribe to the newsletter
Let’s build the smartest Mets community on the internet